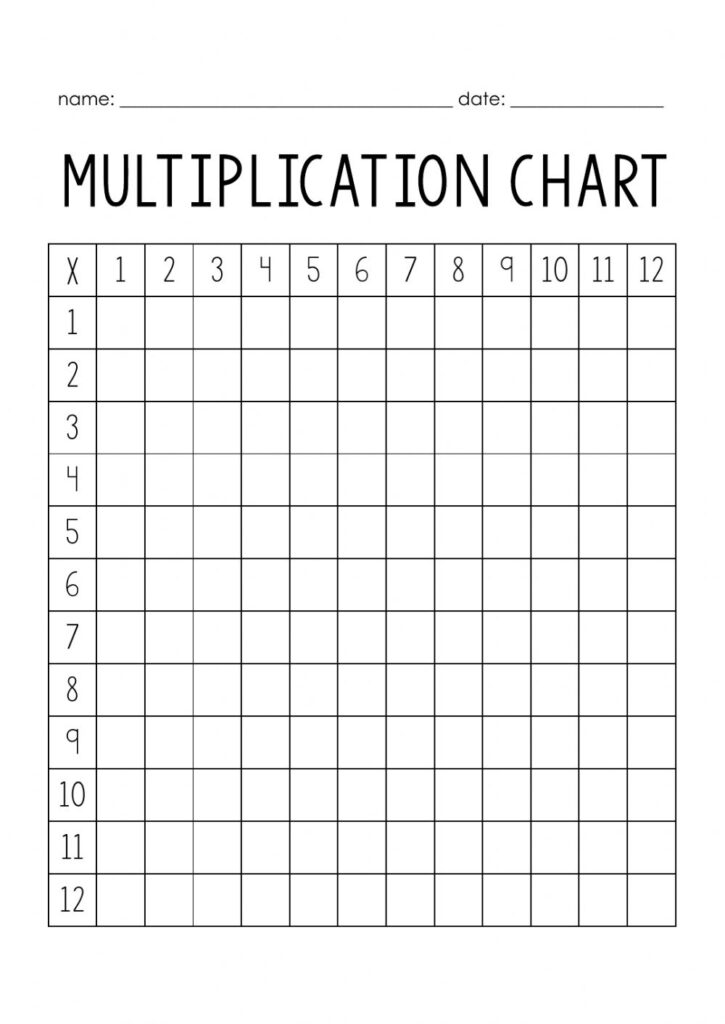
A filled out multiplication chart is a handy tool that displays the results of multiplying two numbers together. It typically consists of a grid with rows and columns representing the numbers being multiplied. Each cell in the grid contains the product of the corresponding row and column numbers.
For example, in a 10×10 multiplication chart, the cell in the 2nd row and 3rd column would contain the number 6, which is the result of multiplying 2 and 3 together.
Filled Out Multiplication Chart
How to Use a Filled Out Multiplication Chart
Using a filled out multiplication chart is simple and can be a great learning tool for students. To find the product of two numbers, locate the row corresponding to the first number and the column corresponding to the second number. The number at the intersection of the row and column is the product of the two numbers.
For instance, if you want to multiply 4 and 7, find the row labeled 4 and the column labeled 7. The number at the intersection of the row and column, in this case, 28, is the result of multiplying 4 and 7 together.
Benefits of Using a Filled Out Multiplication Chart
Filled out multiplication charts can be a valuable resource for students learning multiplication facts. They provide a visual representation of the multiplication table, making it easier for students to understand and memorize the relationships between numbers. Additionally, using a filled out multiplication chart can help students practice their multiplication skills and improve their speed and accuracy in multiplication calculations.
Overall, a filled out multiplication chart is a useful tool for students of all ages to enhance their multiplication skills and build a strong foundation in mathematics.
